TOLL FREE : 1-866-363-6634
A Service-Disabled Veteran-Owned Small Business
Suport data analyze with easy operation
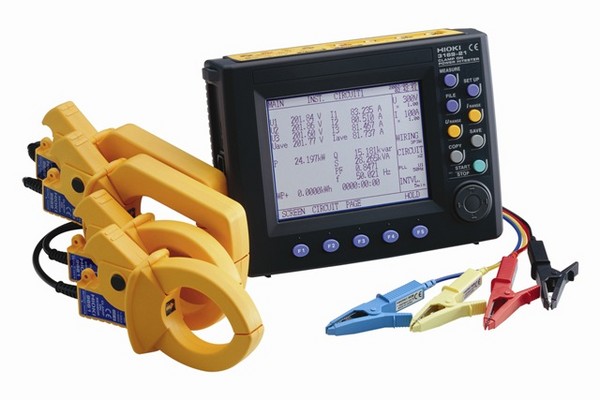
When analyzing measurement data (binary) on the PC with the PW3198, please use PQA-HiVIEW PRO 9624-50 version 2.0 or later. Save binary data from the PW3198 to the PC using the SD card or PC transfer, from the 3197 with a USB connection, or from the 3196 with a PC card or PC transfer
| Compatible Devices | POWER QUALITY ANALYZER PW3198, 3197, 3196 |
| Supplied Media | CD-R ×1 |
| Operating Environment | Computer running under Windows XP/Vista (32-bit), or Windows 7 (32-bit/64bit) |
| Data Loading | PW3198: Saved binary data 3197: Saved binary data 3196: Saved binary data |
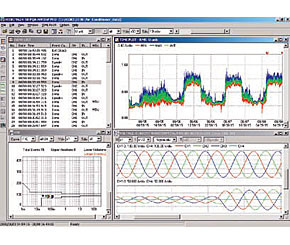
| Screen Display | System, Time plot, Event list, Event data, Cursor function, Fluctuation graph of event voltage, Graph of event inrush current (at only PW3198, 3197), Integrated power, Demand |
| Copy Function | Text data, Screen copy to clip-boad |
| Print Function | Screen image, A4/ letter size, preview |
| CSV Convert Function | Time plot, Event waveform, Fluctuation of event voltage, Inrush current of event (at only PW3198, 3197), Flicker graph (at only PW3198, 3196), Demand, Integrated power |
| Report Generation | Auto output: RMS voltage fluctuation graph, Worst case, Maximum/ minimum value list, Voltage total harmonic distortion percentage graph, All event waveforms, Detailed list of all events, other custom output, or detailed output |
| Only for the PW3198 and 3196 | [Screen display] Voltage, Transient waveform, Vector, DMM, Harmonic, Zero-, positive- and negative-phase calculations, Flicker graph, Cursor, High harmonic analysis orders (PW3198) [Integrated Power Calculation] Analysis period: 1 – 35 days (PW3198)/ 31 days (3196), Graph, Consumption/ regeneration value, Cursor measurement, Maximum integrated power [Demand Calculation] Demand period: 5 – 30 minutes, 1 – 12 hours, Analysis period: 1 – 35 days (PW3198)/ 31 days (3196), Demand graph of consumption value, Average demand, Peak demand, Load ratio [ITIC Window] Event points are plotted on a tolerance curve (event duration versus swell, dip or interruption voltage percentage), Voltage percentage, Violation count display, Tolerance curve selection [EN50160 Screen] Classification by overview, harmonic, signaling detail (3196) or measurement results [Data Download] Via LAN [Saving settings] User-defined ITIC curves, Classification settings for measurement results, or other |